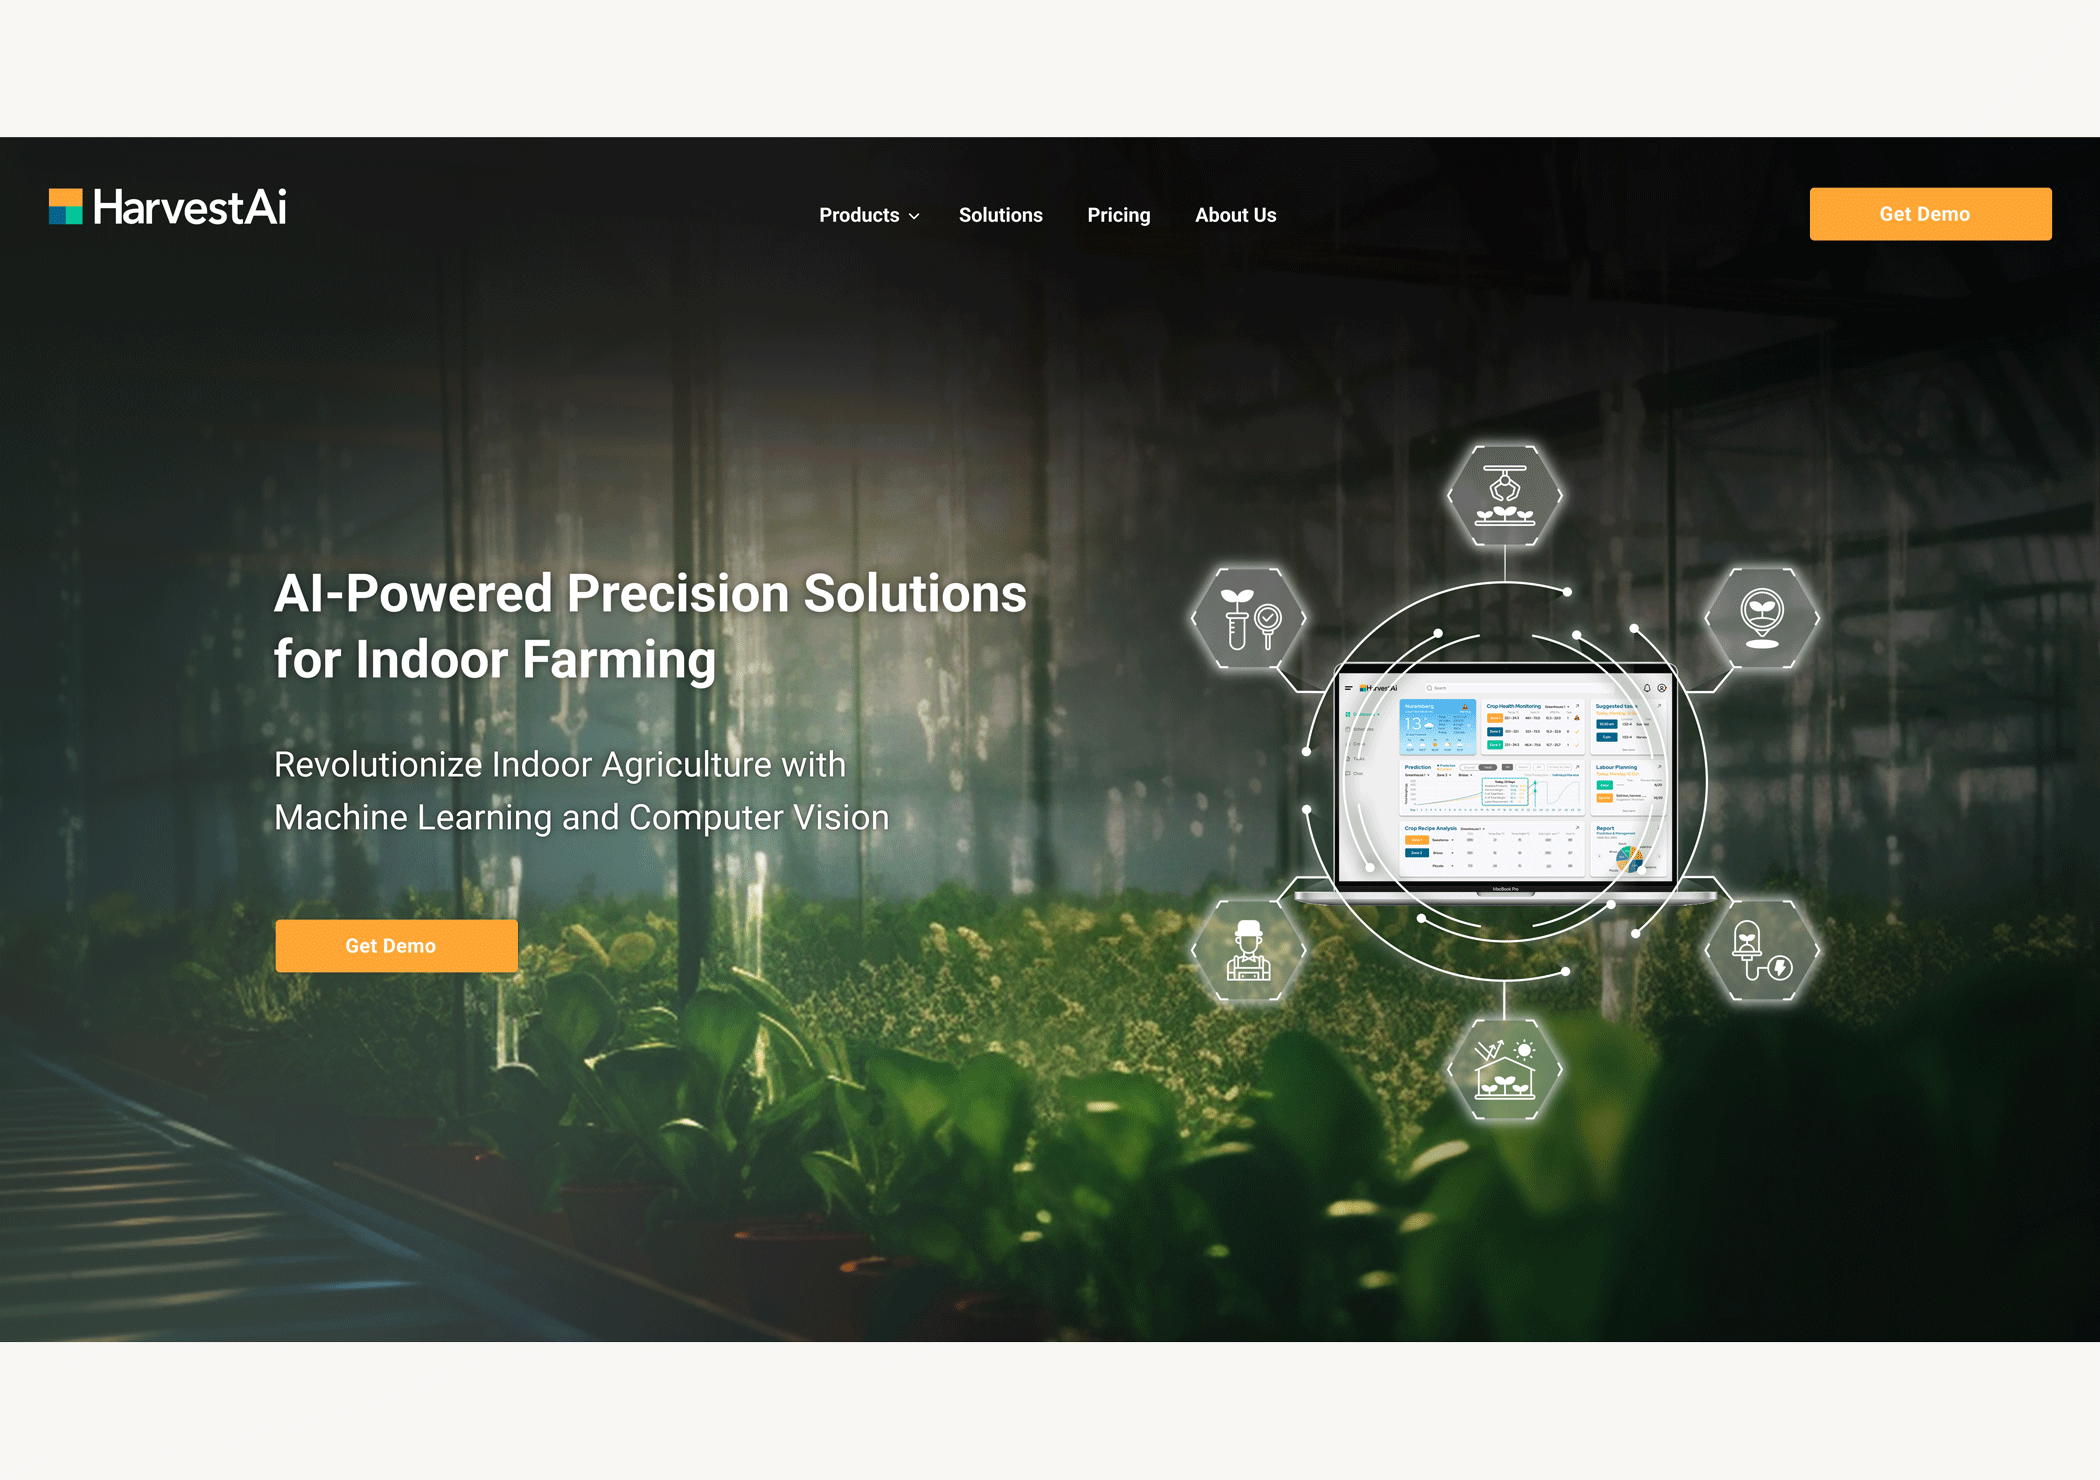
AI indoor farming software
Role: Lead UX/UI Designer (solo)
Timeline: 20 months (Discovery → Delivery)
Platform: Web app (desktop + tablet), responsive fallback
Design: Figma, Balsamiq, InVision, Adobe Illustrator, Photoshop, After Effects
Project Management: Jira, Coda, Microsoft Teams
Research & Documentation: Miro, Google Docs, Zoom (interviews), Coda, PowerPoint, Excel
Collaboration: 1 Product Manager, 3 Plant Experts, 4 Data Scientists, 2 Developers
Overview
In commercial greenhouse operations, even a 5% error in yield forecasts can result in overharvesting, waste, or lost revenue. Traditional planning tools are fragmented and rely heavily on gut instinct. Master growers, sales leads, and delivery teams struggle to coordinate around unreliable data.
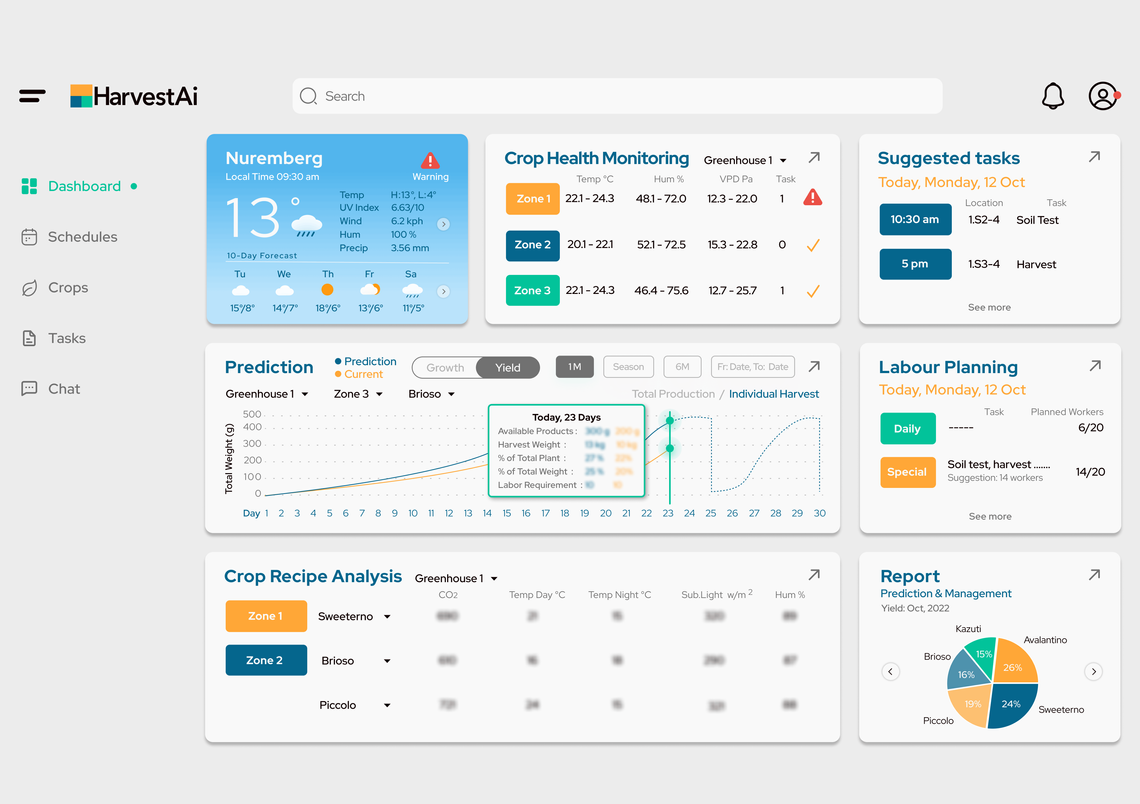
I designed an AI-powered forecasting platform that uses computer vision (CV) to deliver real-time, precise yield predictions. The product bridges operational silos, enabling proactive planning across growing, sales, and logistics through a user-centered interface.
This project highlights how I independently led the UX/UI design, from research to implementation, translating complex AI outputs into actionable tools that drive measurable impact.
Disclaimer: All personas, metrics, and business details in this case study have been anonymized or fictionalized to respect confidentiality agreements.
Problem
Commercial greenhouse growers face unpredictable yields due to weather, plant variability, and human error. Traditional manual forecasting was:
- Inaccurate (error margins of 20–25%)
- Time-consuming (2–3 hours per week)
- Poorly documented, leading to miscommunication between departments
This resulted in overproduction, spoilage, and lost revenue, up to €20,000 per season in larger operations.
Objective
Design a user-friendly interface for an AI + Computer Vision platform that:
- Generates 14-day yield forecasts
- Visualizes live crop data from CV cameras
- Replaces manual harvest planning
- Works offline in remote greenhouses
Discovery & Research
User Research
Target Users:
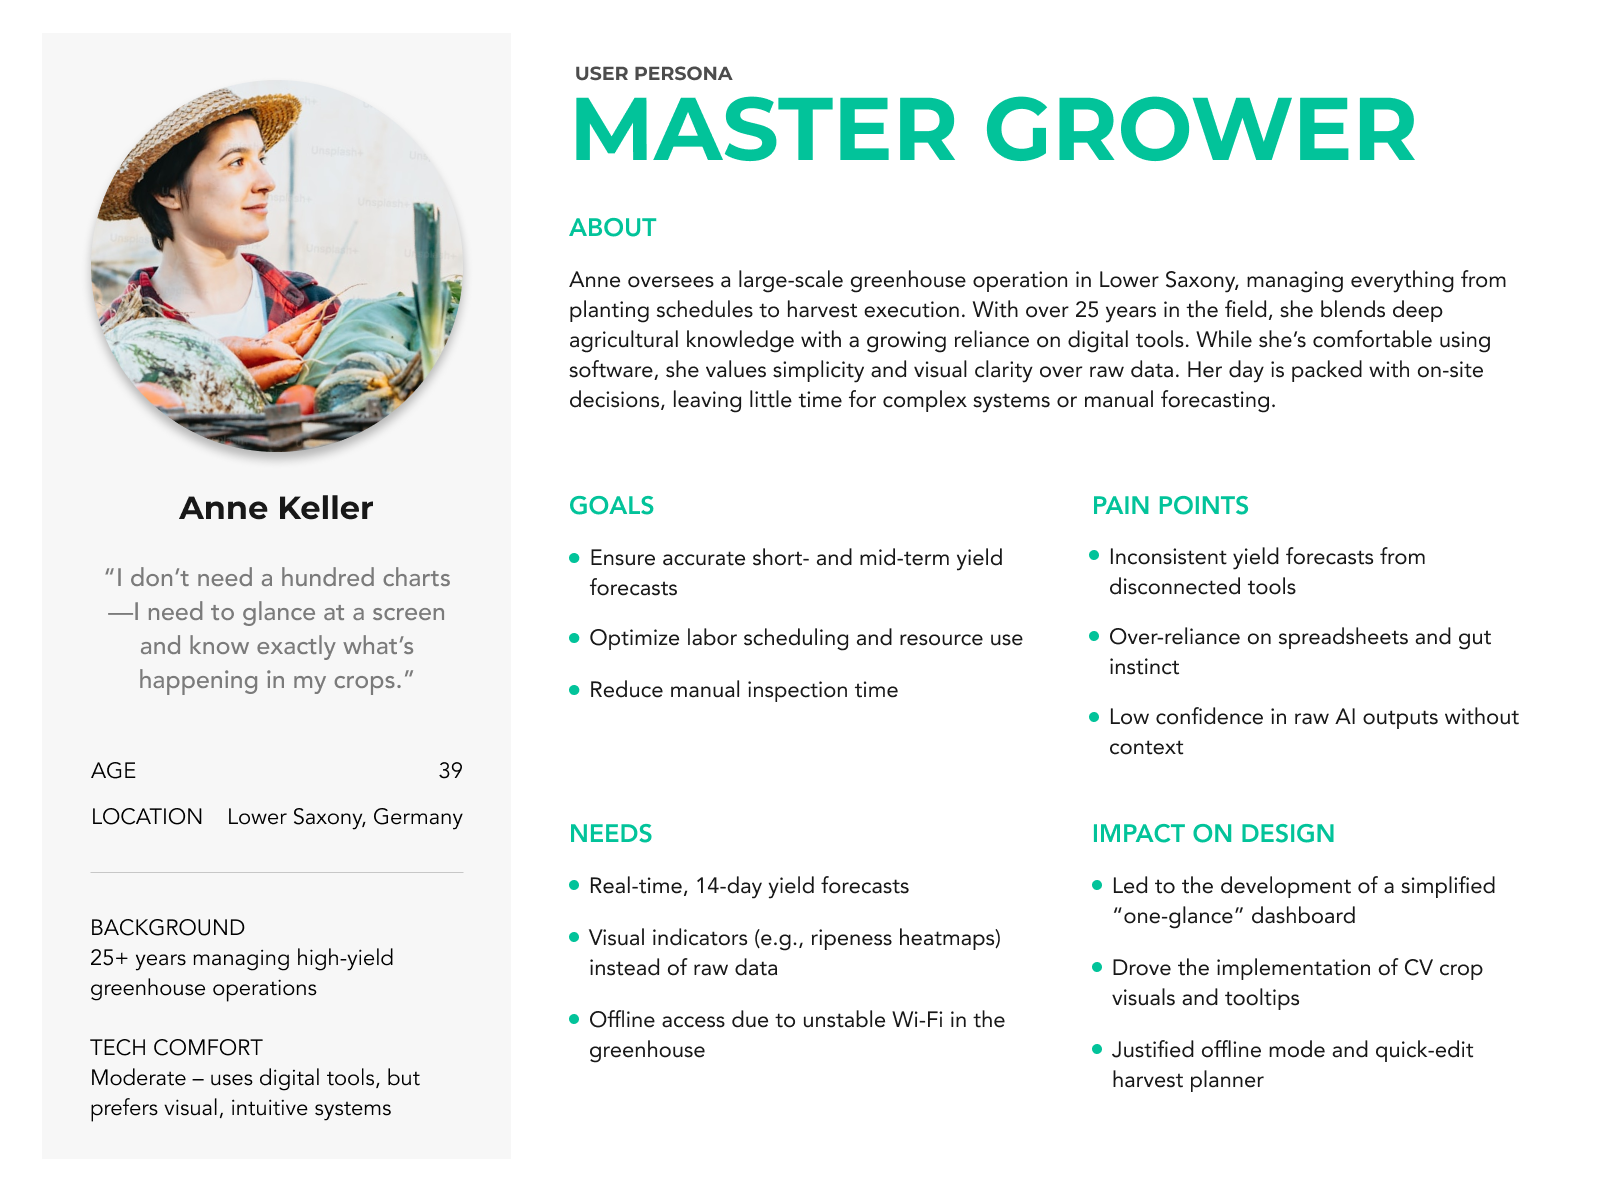
- Master growers
- Operations managers
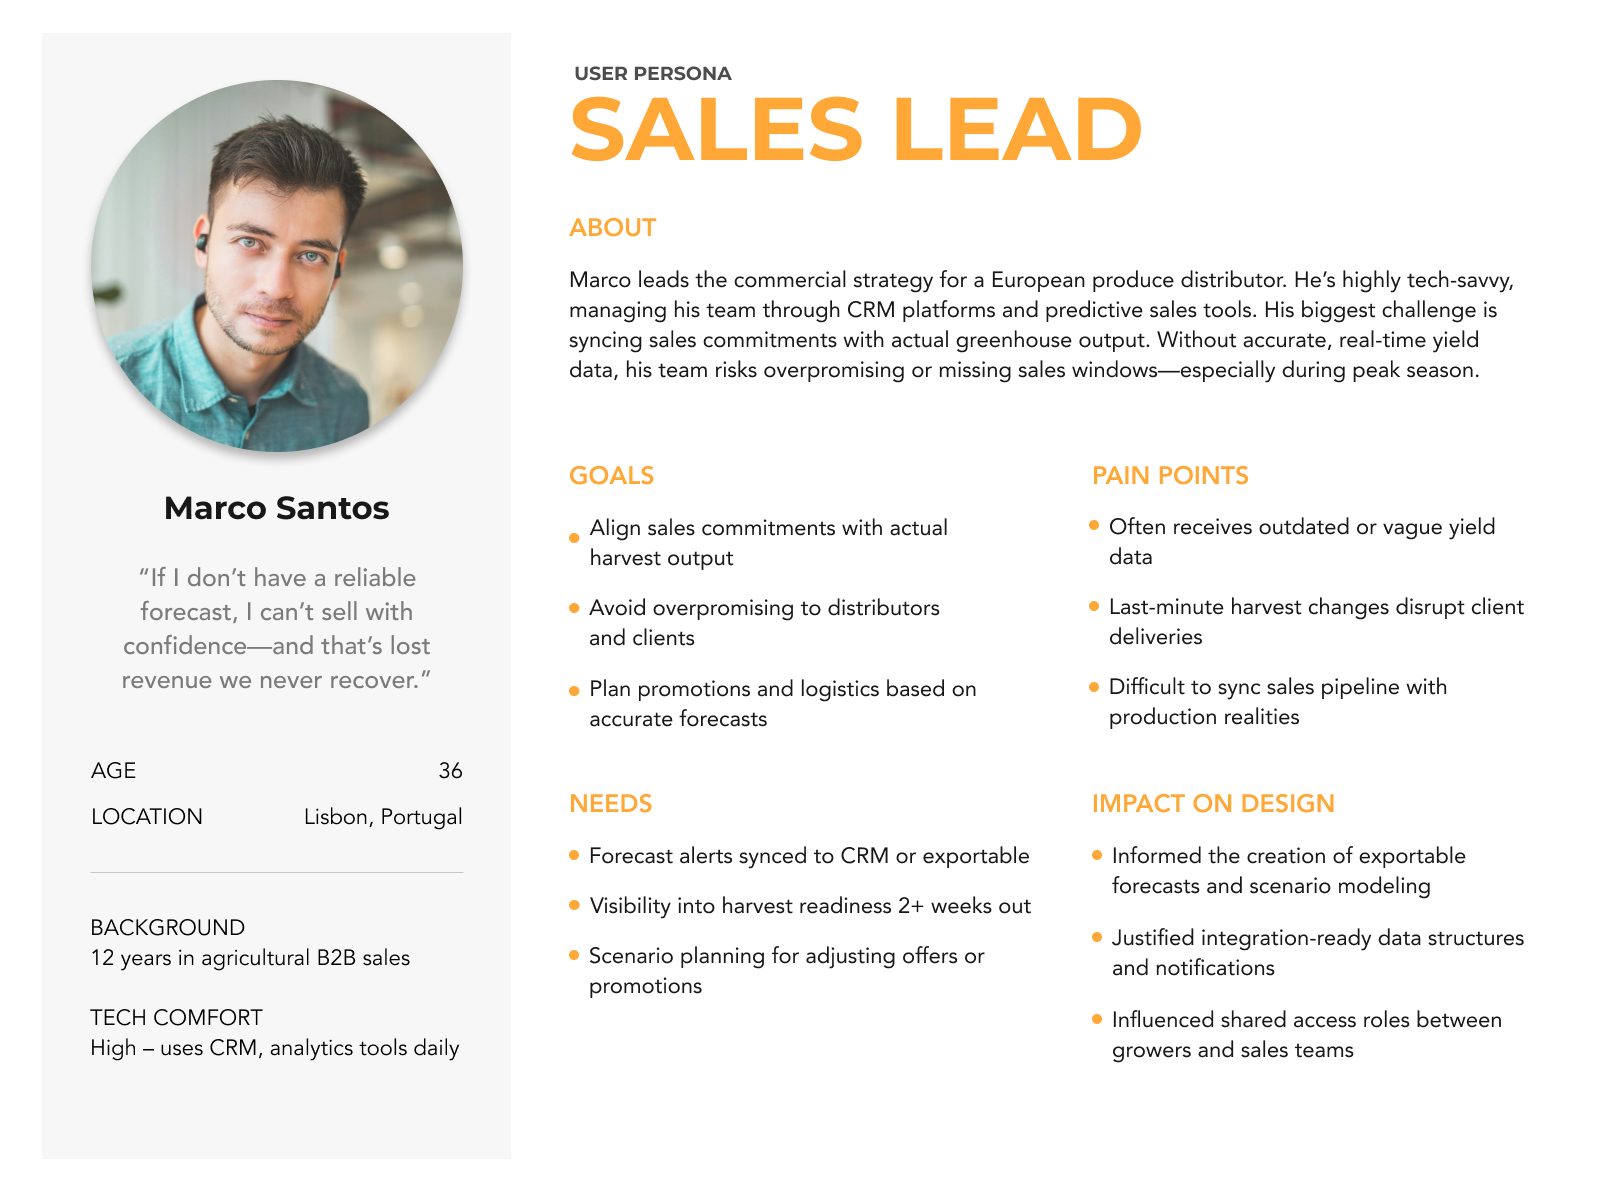
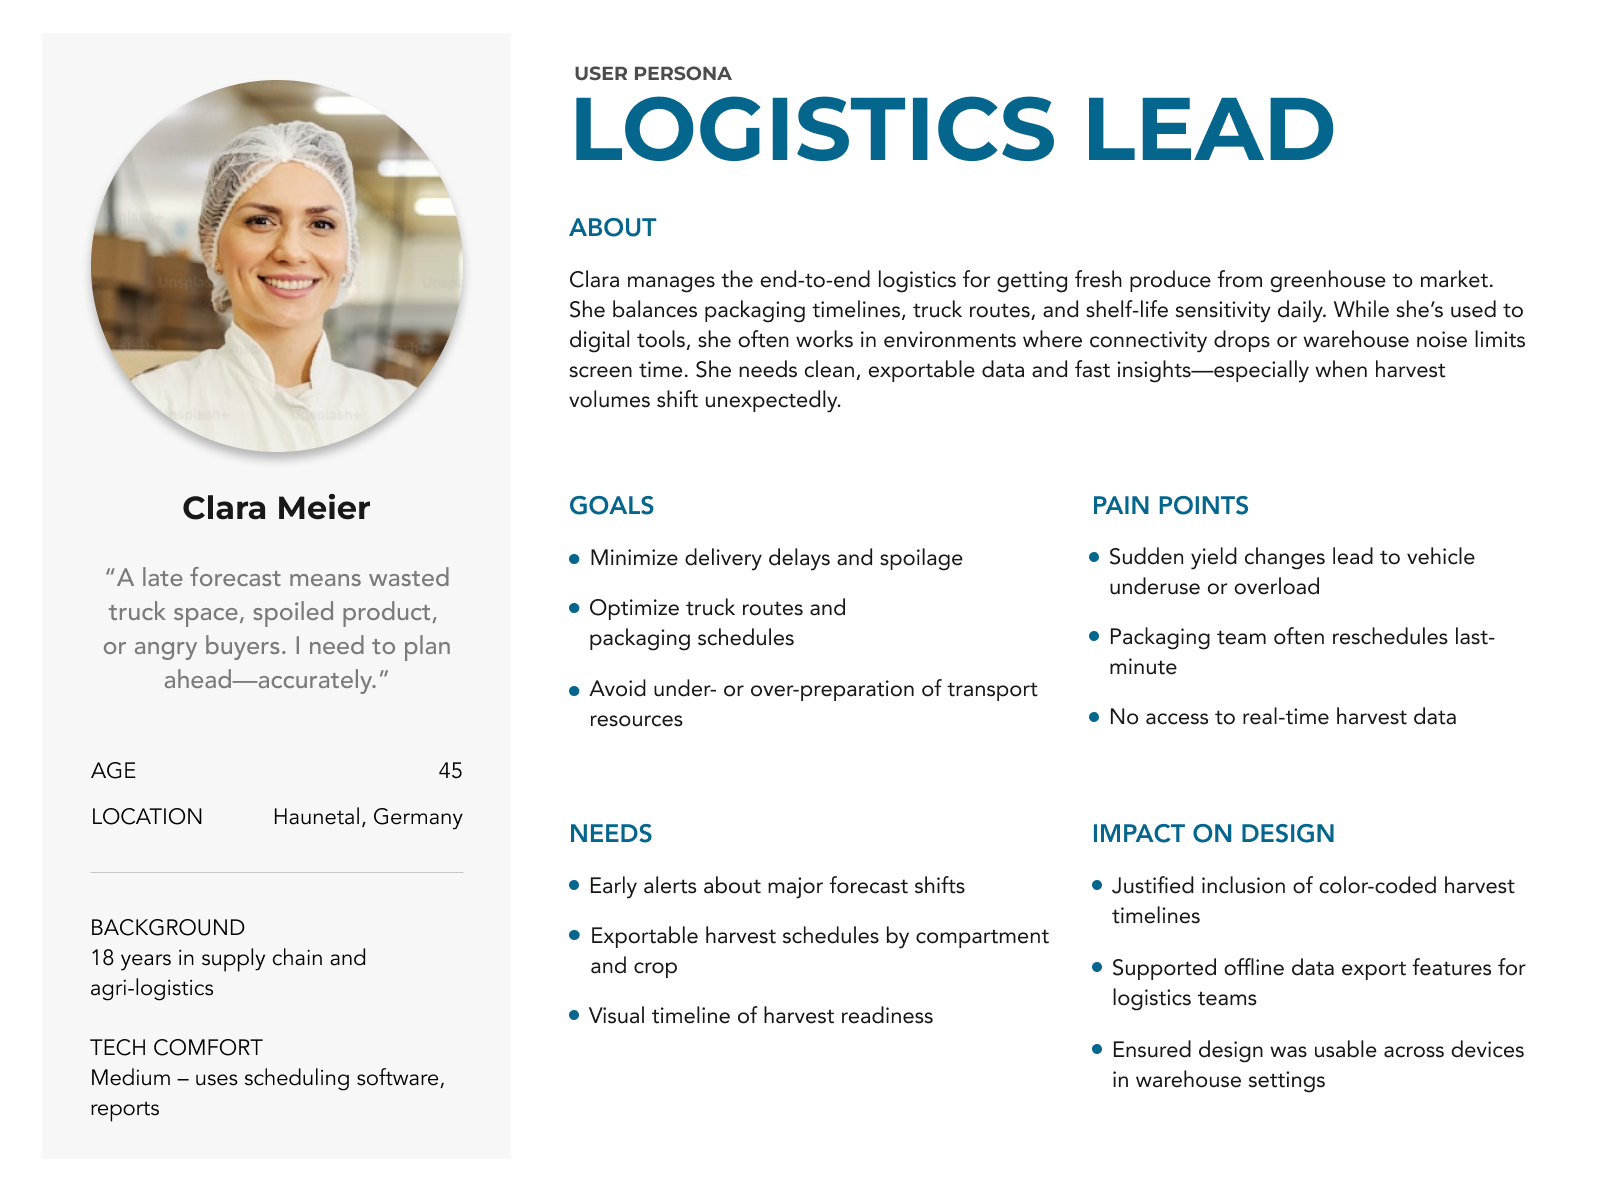
- Logistics and sales coordinators
Methods:
- In-depth Interviews (n=15): Conducted one-on-one sessions with growers, asking targeted questions like, “What’s the biggest bottleneck in your current yield planning?” and “How do you adapt to unexpected crop changes?”
- Contextual Observations: Spent four days in greenhouses, shadowing growers to map their workflows—identifying pain points like repetitive data entry and delays in accessing forecasts.
- Workshops (n=3): Facilitated collaborative sessions with product managers and developers to align on technical constraints (e.g., CV integration) and business goals (e.g., reducing planning time by 25%).
- Surveys (n=20): Distributed questionnaires to validate qualitative findings, focusing on growers’ reliance on manual methods and their openness to AI tools.
Findings:
- Forecast accuracy is meaningless without visual proof.
- Decisions are made during field walks—mobile access is key.
- Teams use spreadsheets, whiteboards, and WhatsApp—high fragmentation.
- Growers need 14-day yield forecasts updated in real-time to plan harvests effectively.
- Offline access is non-negotiable due to unreliable internet in remote greenhouses.
- CV-driven insights (e.g., ripeness detection) could cut manual inspections by 35%, freeing up critical time.
Core Insight:
Growers trust what they see. CV data must be paired with clear visual context to gain adoption.
Analysis Methods Applied
- Content Analysis
I systematically reviewed and categorized textual data from documents such as usability testing reports and demo feedback files. This involved interpreting the content to uncover patterns, themes, and insights related to user experience and software functionality. - Thematic Analysis
By examining multiple files, I identified recurring themes, like user pain points and desired features. This helped prioritize design improvements, especially tailored to the needs of master growers. - Stakeholder Mapping
I analyzed the roles and requirements of different stakeholders, including master growers, sales teams, and the delivery coordinator. This ensured the design addressed the primary users’ needs while considering the broader ecosystem. - Iterative Design Thinking
I applied design thinking principles through repeated cycles of prototyping, testing, and refining. This process transformed initial concepts into a polished, user-friendly interface. - Data Triangulation
To validate findings, I cross-referenced insights from interviews, usability tests, and stakeholder feedback. This approach ensured that the design decisions were robust and supported by multiple perspectives.
How These Methods Were Applied
These techniques were used in combination with tools like Figma, InVision, Coda, and Miro to analyze the files and develop a solution. For example, content and thematic analyses helped distill key insights from user feedback, while stakeholder mapping and data triangulation ensured those insights aligned with the needs of all relevant parties. The iterative design thinking approach then translated these findings into actionable design improvements.
This combination of methods allowed me to deeply analyze the files and craft a solution that is both technically sound and intuitive for users, particularly master growers. Let me know if you’d like more details on any specific method!
Personas
User Journeys
Persona 1: Anne Keller – Master Grower
Drives volume-based harvestable fruits.
|
Phase |
Action |
Feeling |
Pain Points |
Design Solution |
|
Trigger |
Enters
greenhouse, wants to plan next week’s harvest |
Curious,
focused |
Can’t
rely on last week’s estimates |
On
open, dashboard loads latest data & updates instantly |
|
Discovery |
Opens
yield forecast app on tablet |
Hopeful |
Too
much info = decision fatigue |
Simplified
interface: big volume % + color cues (green/yellow/red) |
|
Analysis |
Reviews
ripeness overlay, checks forecast trendline |
Alert,
skeptical |
Unsure
if AI prediction matches real field conditions |
Tooltip
explanations + confidence scores build trust |
|
Decision |
Adjusts
plan based on weekend weather & crop visuals |
Empowered |
Doesn’t
want to override AI blindly |
Semi-automatic
planner: AI suggests, user finalizes |
|
Collaboration |
Exports
forecast to share with logistics and sales |
Relieved |
Manual
copy-paste wastes time |
1-click
export + Slack/Email notifications built-in |
|
Wrap-up |
Closes
app, heads out to field |
In
control |
Worries
about Wi-Fi loss wiping progress |
Offline
cache + autosave ensure all edits persist |
Persona 2: Marco Santos – Sales Lead
Drives volume-based deals with retail chains. Needs accurate yield info early to secure orders.
|
Phase |
Action |
Feeling |
Pain Points |
Design Solution |
|
Trigger |
Gets
push notification: “Next week’s yield forecast is live” |
Interested |
Forecasts
often change last-minute |
Push
alerts only after grower finalizes forecast |
|
Check
Forecast |
Logs
into dashboard → selects crop & week |
Curious,
cautious |
Doesn't
trust forecast blindly |
Shows
AI confidence % + grower validation badge |
|
Plan
Sales |
Matches
available volume to pending retail orders |
Strategic |
Needs
to lock volume before competitors |
Real-time
syncing with sales planning board |
|
Negotiate |
Sends
offer to buyers (with forecasted volumes + harvest window) |
Confident |
Needs
to overpromise to avoid underutilized harvest |
Built-in
buffer ranges + alerts for overcommitment |
|
Track
Updates |
Checks
daily for changes or confirmed volumes |
Focused |
Too
much email clutter |
In-app
timeline: logs every plan adjustment |
|
Close
Deal |
Confirms
buyer deal & syncs with delivery team |
Satisfied |
Misalignment
with delivery leads to client complaints |
Shared
“confirmed yield” board auto-syncs across teams |
Persona 3: Clara Meier – Logistic Lead
Manages truck schedules and cold chain logistics based on the final harvest plan.
|
Phase |
Action |
Feeling |
Pain Points |
Design Solution |
|
Trigger |
Receives
update: harvest window locked, yield confirmed |
Alert |
Too
many last-minute surprises |
Notifications
sent only when forecast is confirmed, not draft |
|
Plan
Transport |
Logs
in → downloads export plan → enters truck schedules |
Focused |
Crop
type affects crate size, truck type |
Export
includes packaging config & weight estimate |
|
Coordinate
Teams |
Calls
warehouse + driver team with schedule |
Rushed |
Manual
handoffs waste time |
Auto-email
export with checklist (crates, ice packs, etc.) |
|
Track
Status |
Monitors
pick-up vs. delivery delays |
Anxious |
No
visibility on harvesting delays |
Harvest
team app syncs real-time status → triggers alerts if delay detected |
|
Report
Issues |
Logs
delivery issue in app (e.g. delayed truck) |
Responsible |
No
system for structured feedback |
1-click
issue log with timestamp, delivery type, impact level |
|
Close
Loop |
Confirms
all orders delivered and closes delivery log |
Accomplished |
Has
to chase team for confirmation |
Auto-reminders
+ checklist that confirms final delivery stage |
User Flow
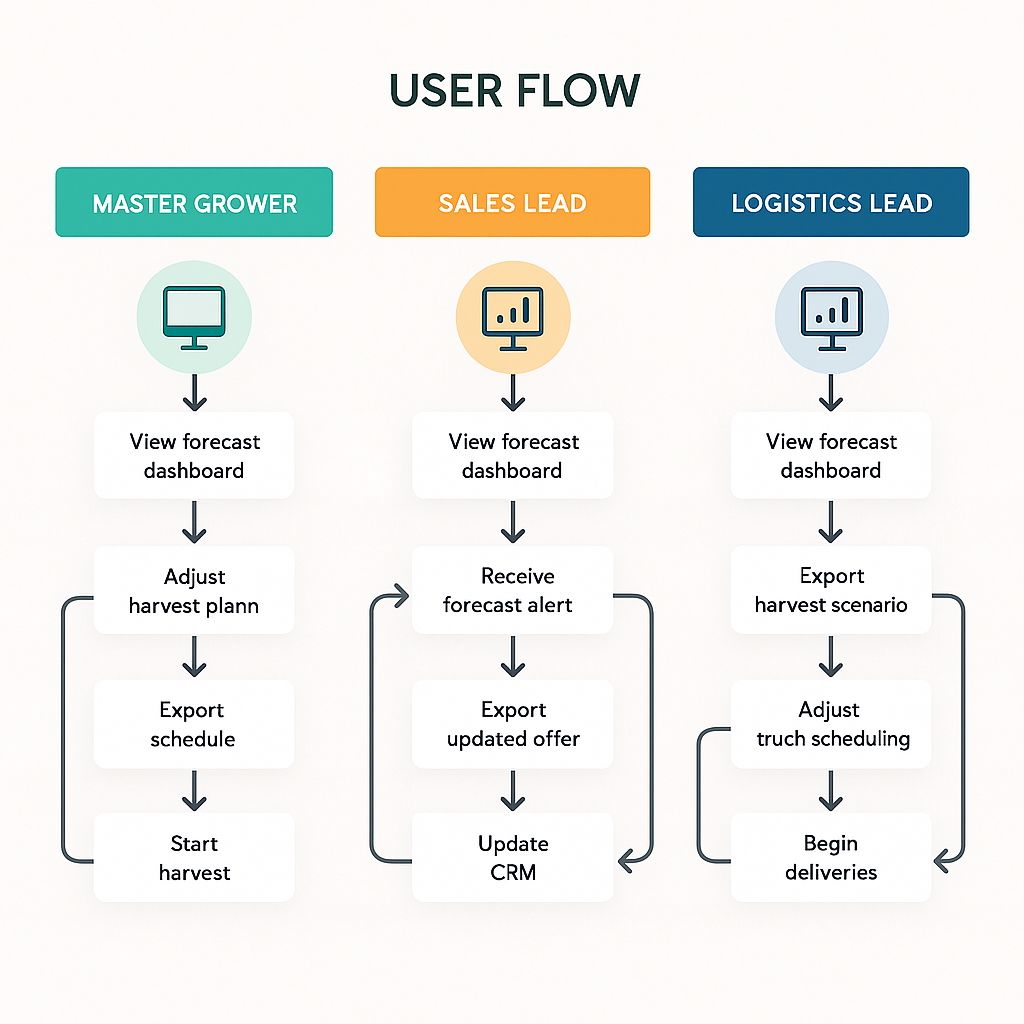
Master Grower : Forecast yields, monitor crop health, and plan harvests efficiently.
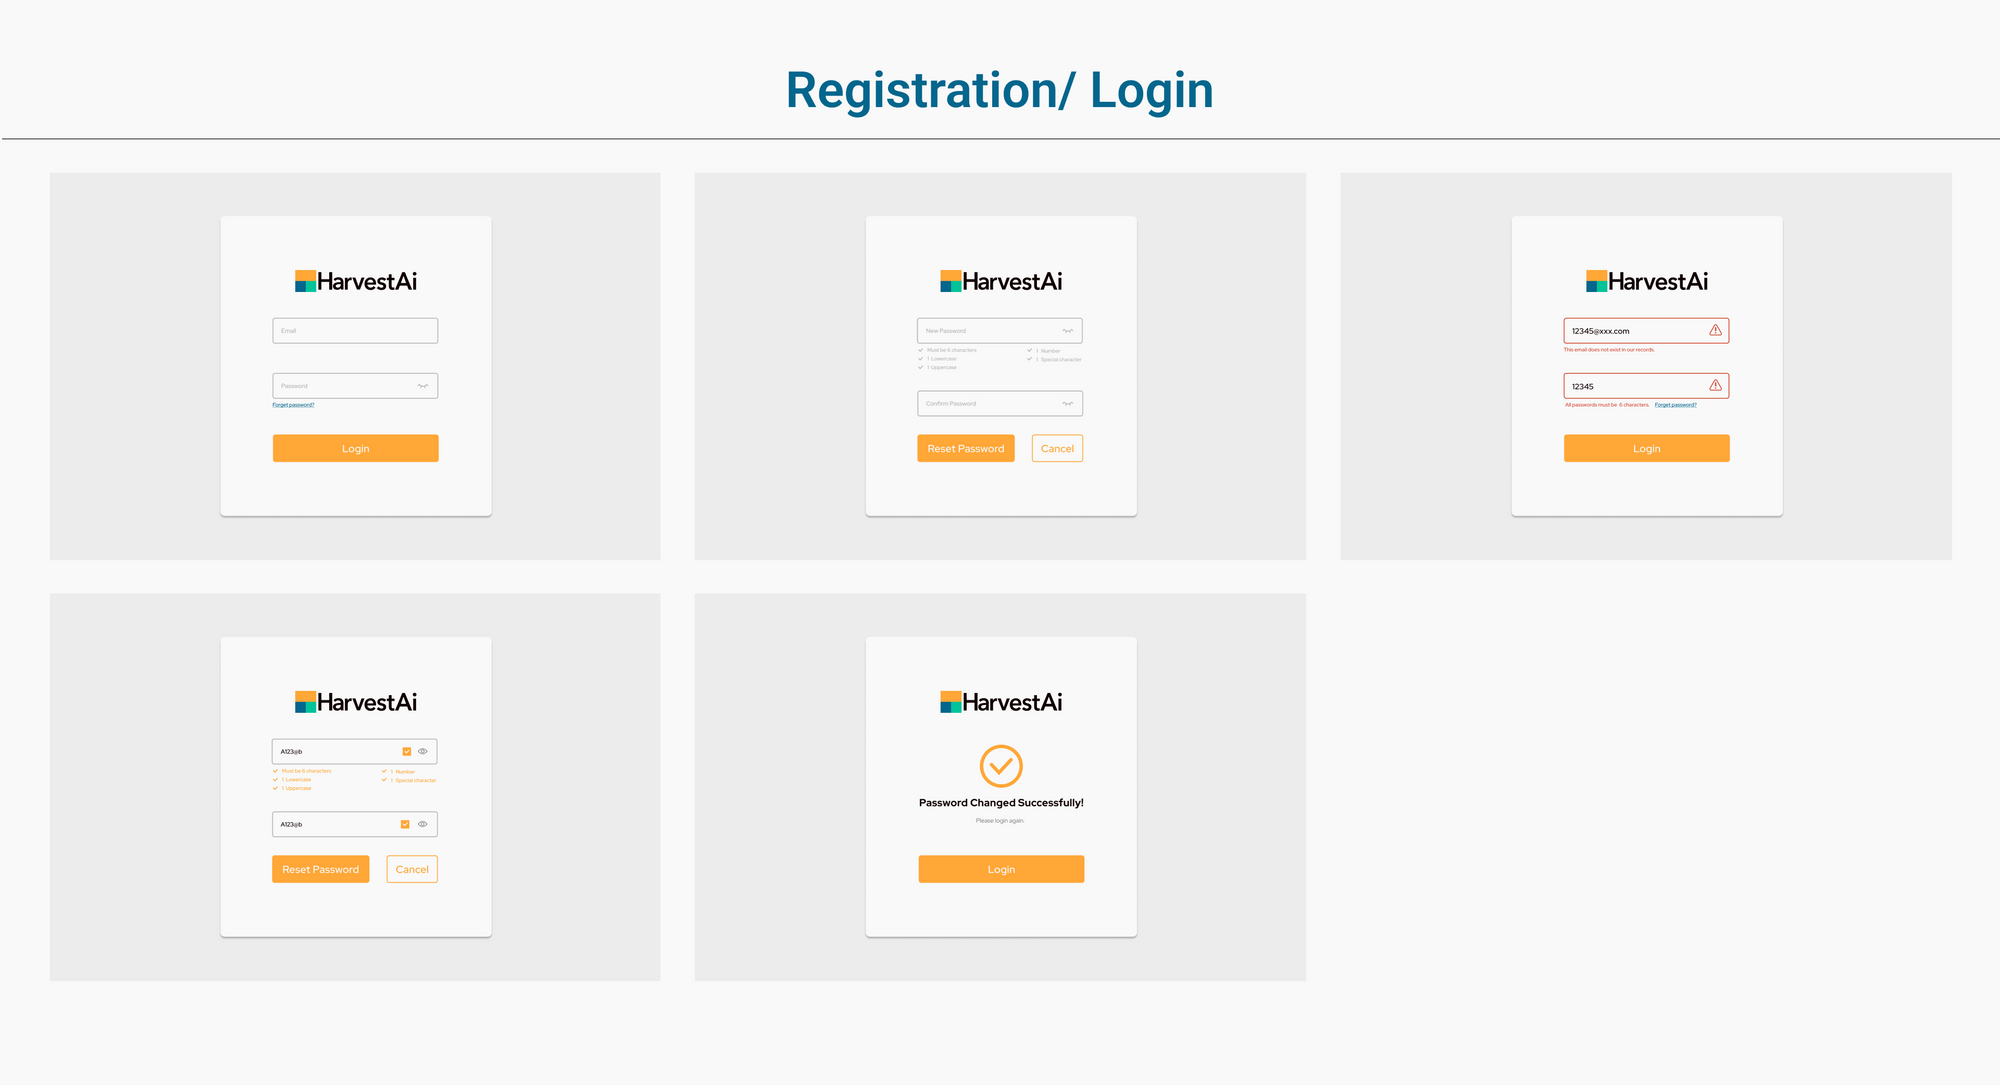
1. Login & Select Greenhouse Section
- Open app → Authenticate (login)
- View dashboard overview
- Select greenhouse compartment (e.g., “Zone B - Tomatoes”)
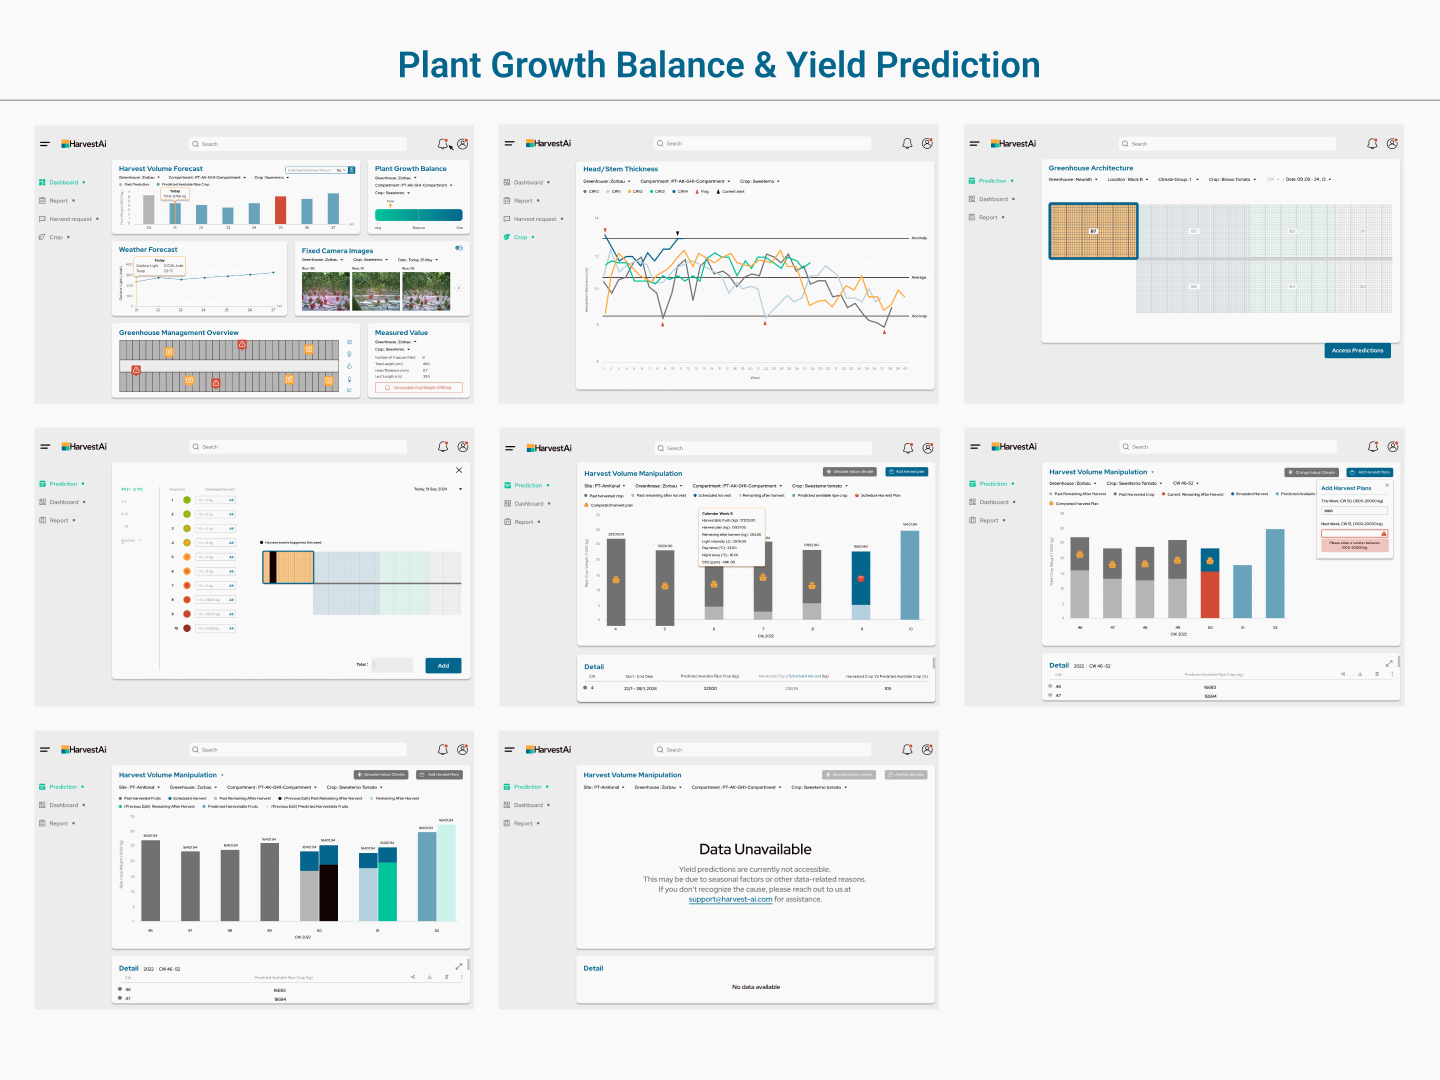
2. Review Yield Forecasts
- View 14-day AI-generated yield projection
- Toggle variables (e.g., light exposure, irrigation)
- View updated yield outcomes in real time
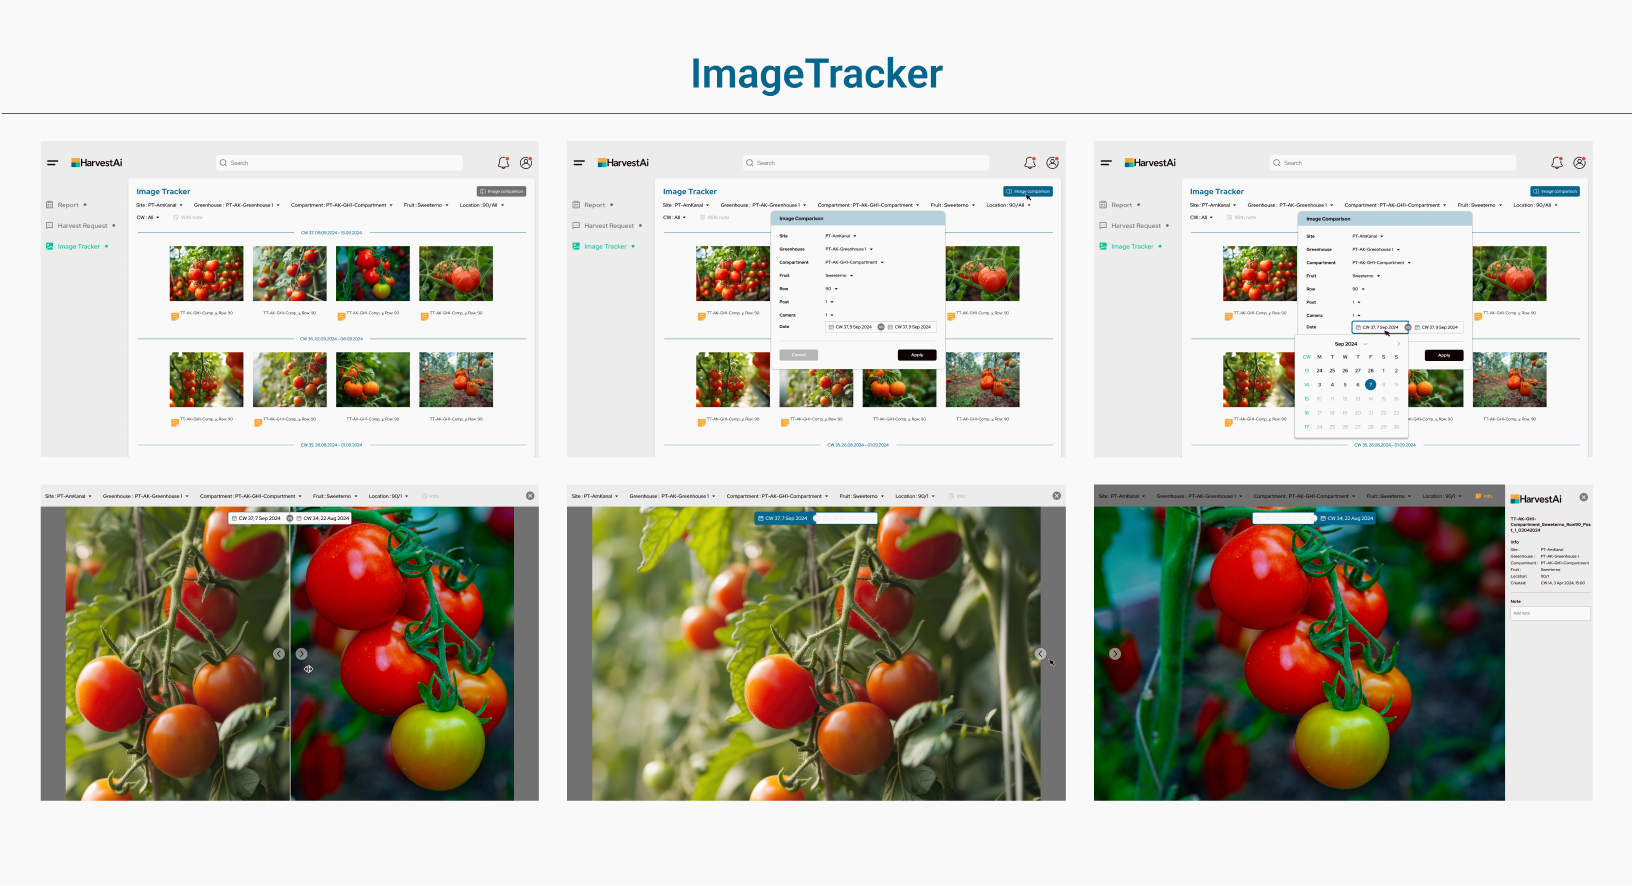
3. Monitor Crop Health
- Access "Image Tracker"
- Review live imagery + health metrics (e.g., ripeness %, pest risk)
- Zoom into plant-level views for critical areas
4. Plan Harvest
- Enter the intended harvest quantity for the upcoming days
- Use an interactive slider to simulate "what-if" scenarios
- Confirm and save the plan for team visibility
- Enable offline sync if needed
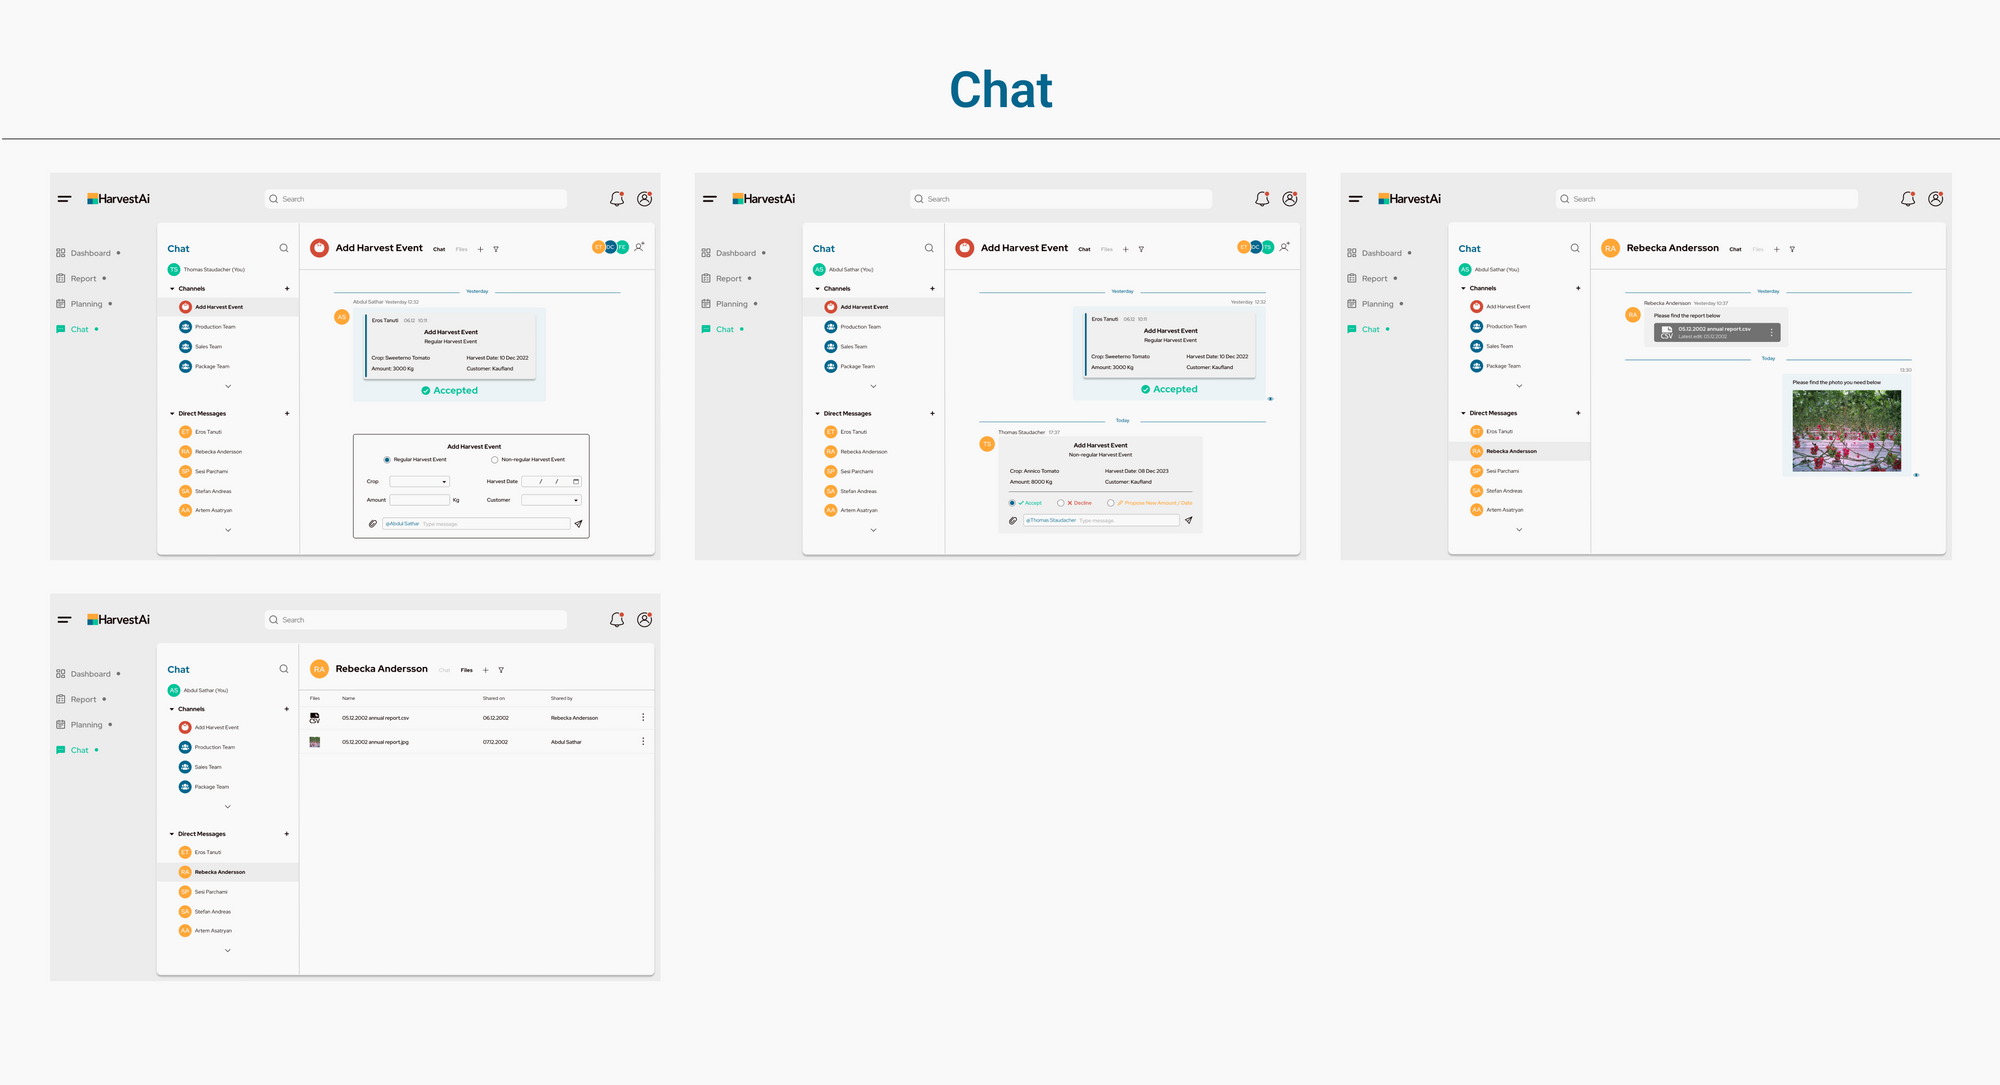
5. Sync with Teams
- Push forecasted volumes to the sales and delivery modules
- Receive alerts if predictions or plant health change
Sales Lead: Primary Goal: Align sales orders with available yield and plan customer commitments.
1. Login & Access Sales Dashboard
- Open platform → Authenticate
- Navigate to “Sales” view
2. View Available Forecast
- Filter by crop type and delivery window
- View 14-day projected volumes by compartment
- Check for high-confidence harvest windows
3. Match Orders with Inventory
- Cross-reference customer demand with yield availability
- Flag low or surplus inventory risks
- Adjust customer commitments as needed
4. Collaborate with Growers
- Leave notes or requests (e.g., “Can we increase output for May 12?”)
- View grower adjustments in real time
- Lock in confirmed sales volumes
5. Export/Share
- Export confirmed sales plan
- Sync with CRM or logistics tools (if applicable)
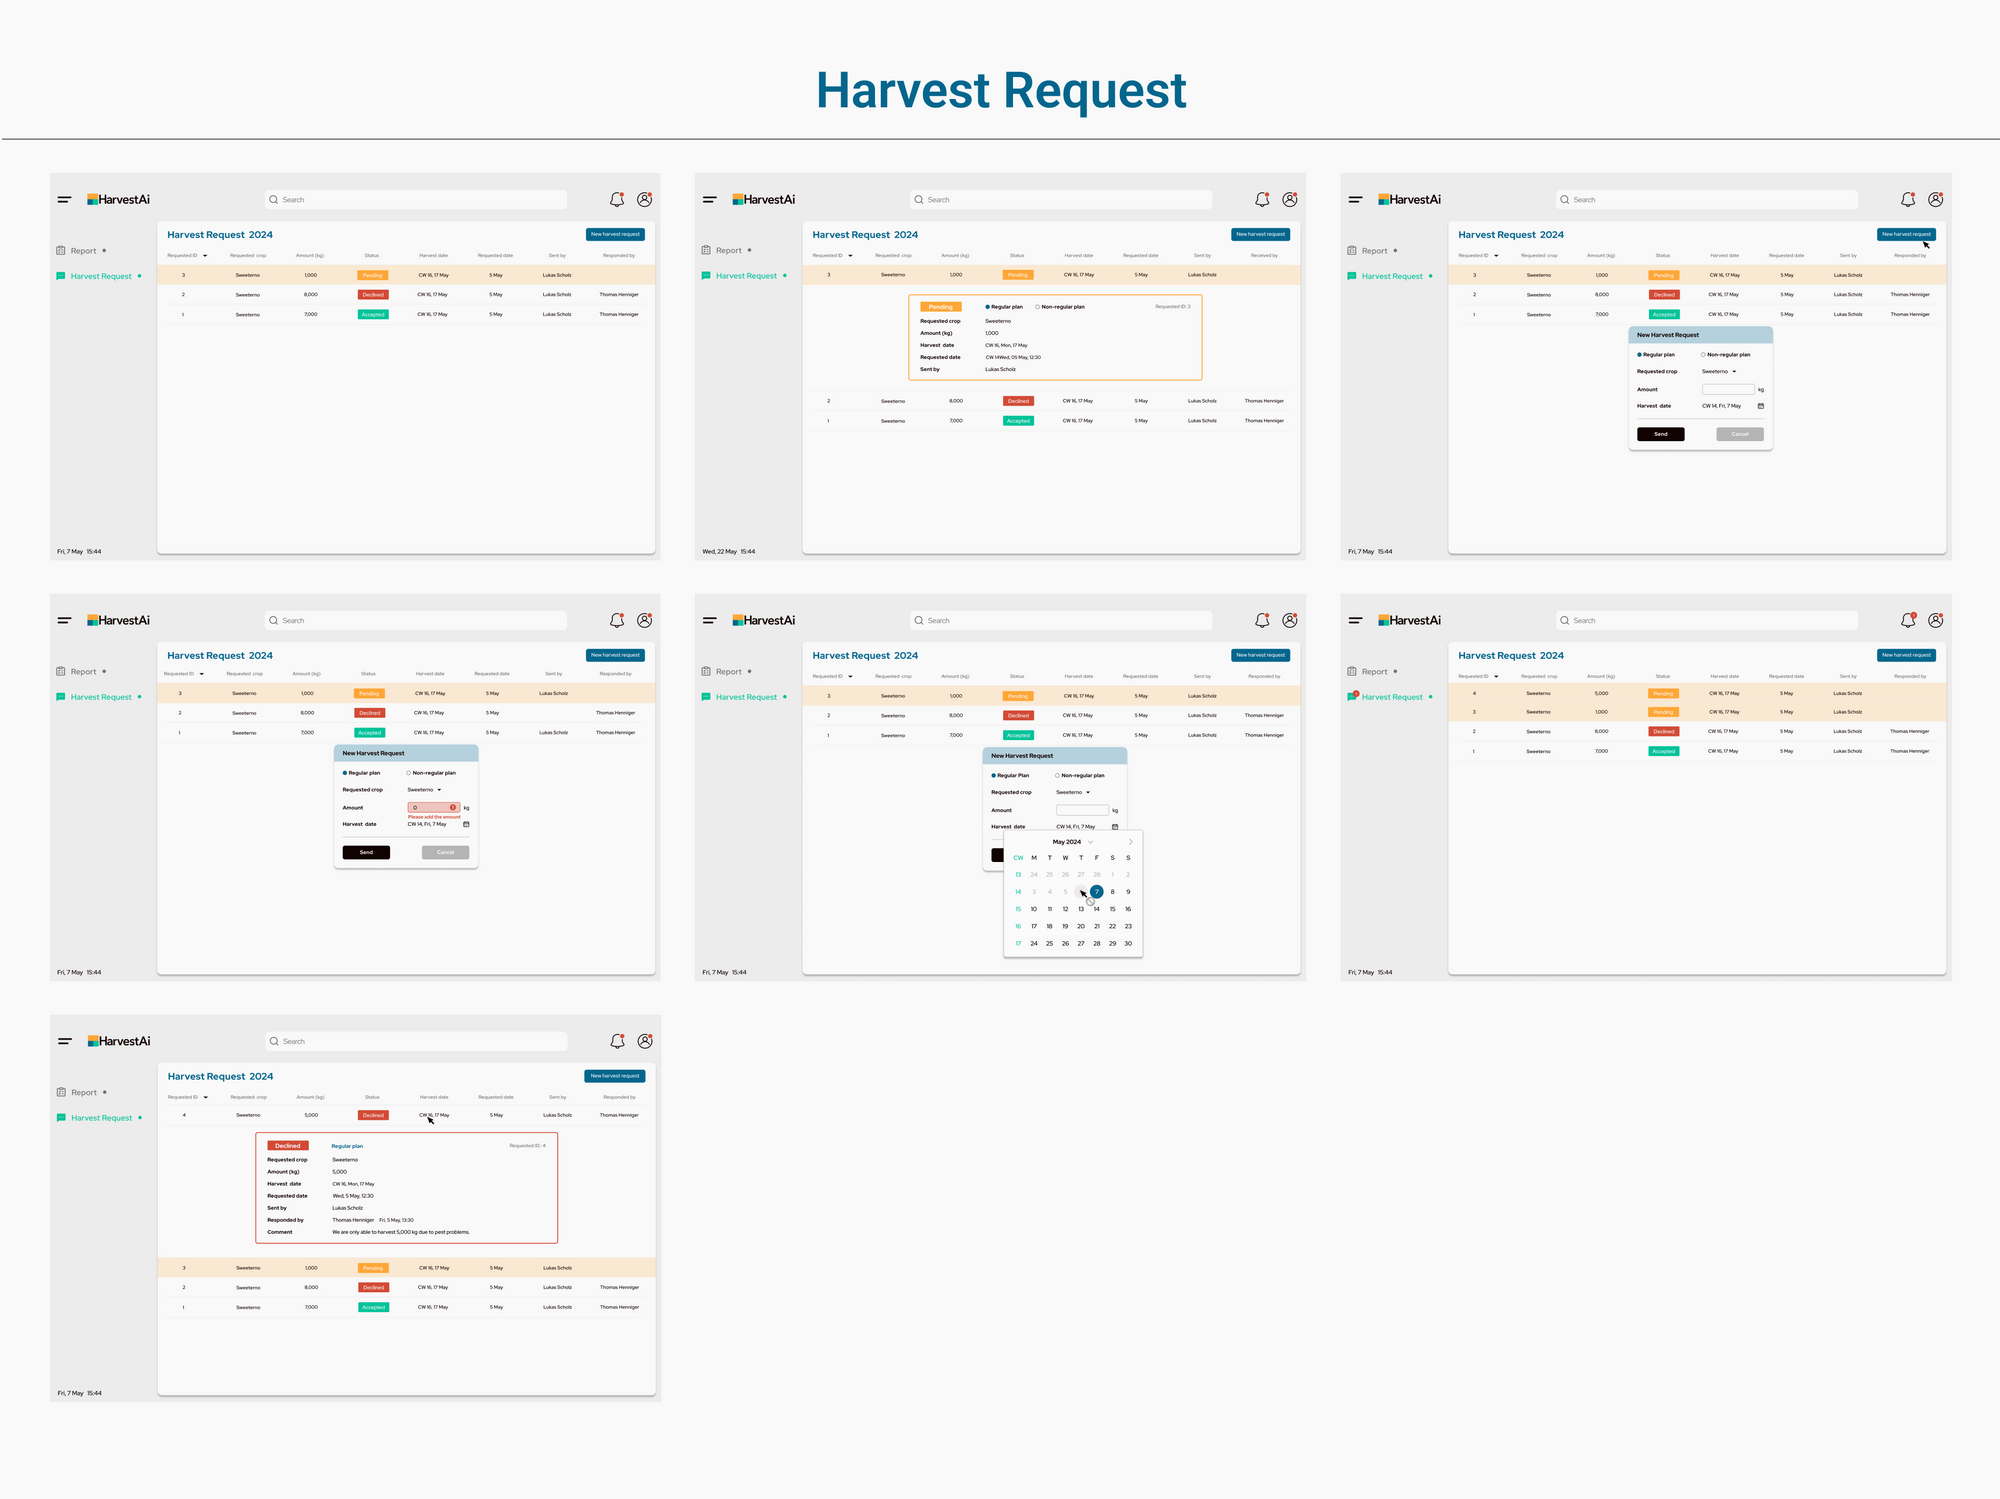
Logistics Lead: Coordinate logistics for confirmed harvests and ensure on-time delivery.
1. Login & Navigate to Delivery Hub
- Open app → Authenticate
- Select “Harvest Request”
2. View Confirmed Harvest Volumes
- Pull the forecast-adjusted harvest plan
- Filter by location, crop, and delivery date
- Get early alerts on volume changes
3. Schedule Logistics
- Assign delivery windows to confirmed orders
- Check packaging, loading capacity, and route planning
- Mark orders as scheduled
4. Handle Disruptions
- If weather or ripeness delays occur:
- Get system alerts
- Coordinate with growers to reschedule delivery
- Notify sales/customer service teams
5. Archive & Report
- Mark deliveries as complete
- Log any discrepancies (e.g., damaged produce, missed weight)
- Generate weekly delivery reports for the operations team
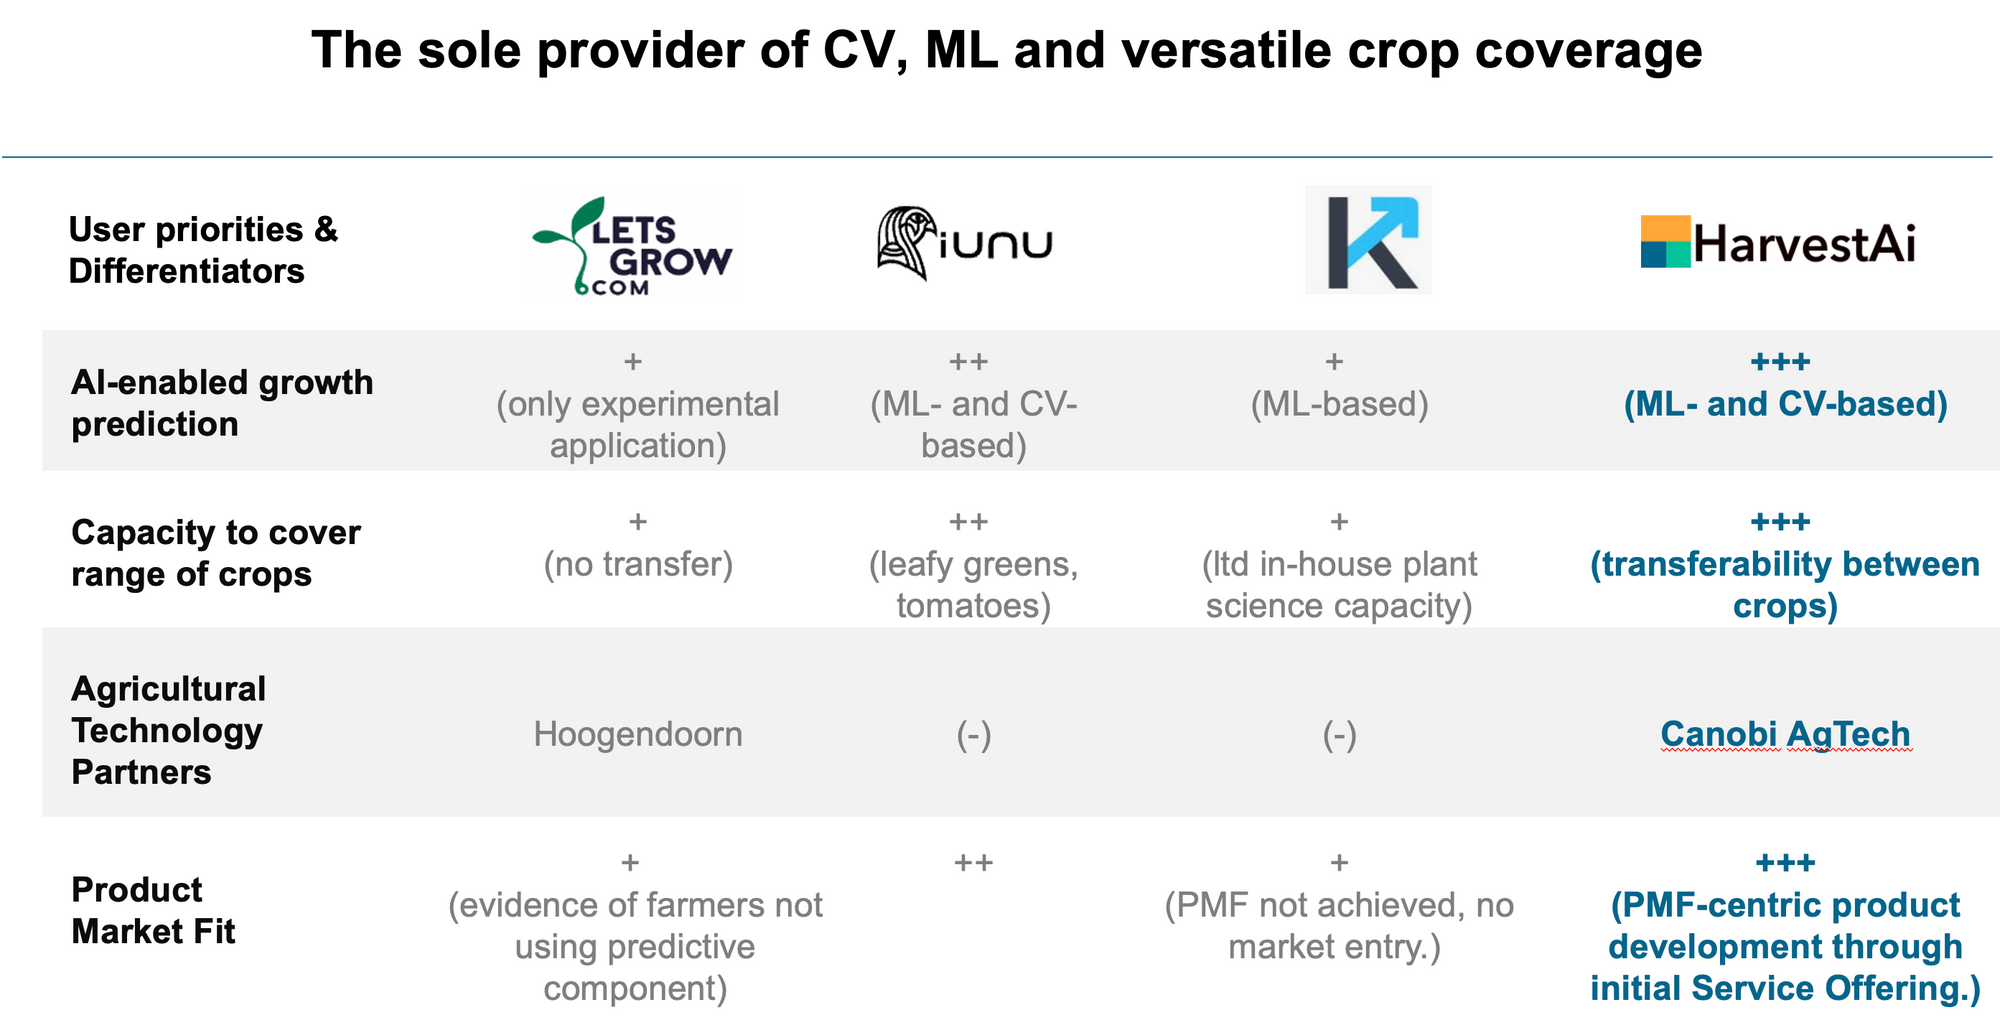
Competitor Analysis
| Company | Core Offering | Approach / Methods | Strengths | Opportunities |
|---|---|---|---|---|
| LetsGrow | ML-driven yield forecasting & grower guidance | Combines plant physiology models with machine learning; achieves ~83–93% accuracy on historical yield data | Data-driven, physiologically informed; trusted accuracy | Lacks real-time CV integration and offline UX |
| iUNU | Real-time CV monitoring & decision support | Deploys camera arrays + AI to monitor every plant continuously; provides actionable insights | Detailed plant-level detection; data ownership policy | No yield forecasting horizon or multi-user workflows |
| Koidra Inc. | AI-based climate + resource automation | Physics-aware AI in DataPilot and KoPilot; automates climate, irrigation; proven yield increases 5–28% | Full-facility control; strong ROI validation; automation | Lacks focus on yield planning UX for sales/logistics teams |
| HarvestAI | AI platform for indoor & greenhouse yield prediction | Uses tailored AI models for crop growth & yield forecasting | Focused on prediction accuracy; indoor farm specialization | Limited public details on integration or UX workflows |
Comparative Summary & Strategic Positioning
Real-time plant data: iUNU leads in CV detection; your product can match that with CV visuals tied directly to yield outcomes.
Automation control: Koidra excels in climate/resource optimization. Your focus on cross-functional UX (grower → sales → logistics) adds strategic differentiation.
Model accuracy: LetsGrow and HarvestAI demonstrate strong accuracy. You can highlight your precision gains (12–15%) and real-world impact metrics in your showcase.
UX gaps: None of these competitors excel in mid-term yield planning UX, offline-accessible workflows, or multi-role collaboration—these are your strengths to emphasize.
How This Informs The Design
Position as the bridge between CV + AI prediction and real-world operations—not just sensors or automation.
Highlight UX-first design, especially around:
14-day yield forecasting dashboards.
Role-based flows (Grower → Sales → Logistics).
Offline mode and quick-edit planning.
Frame your UI as a smarter way to operationalize AI across departments—ideal differentiation from sensor-only or control-focused platforms.
Strategic Analysis Using Jobs to Be Done (JTBD)
Why JTBD?
In B2B agritech, users don’t just “use tools”—they hire them to accomplish mission-critical outcomes.
JTBD strips away vanity features and refocuses the product on why users choose it, what progress they’re trying to make, and what gets in their way.
Core Job(s) to Be Done
1. “When I’m planning upcoming harvests, I want to reliably forecast yield trends so I can prepare resources accordingly.”
Who: Master Growers
Functional goals: Estimate quantity/timing by crop
Emotional drivers: Control, foresight, trust
Barriers: Fragmented data, lack of visibility, high risk of mismatch
2. “When I'm preparing sales offers, I want to align pricing with real availability so I can avoid overpromising.”
Who: Sales Leads
Functional goals: Match supply with demand windows
Emotional drivers: Confidence, professional credibility
Barriers: Unclear readiness indicators, no CRM integration
3. “When I’m planning delivery logistics, I want early warnings on harvest changes so I can allocate trucks and staff efficiently.”
Who: Logistics Leads
Functional goals: Align staffing/vehicles with actual output
Emotional drivers: Stability, operational control
Barriers: Last-minute changes, miscommunication, no offline access
Insights from JTBD Mapping
| JTBD | Current Pain | UX Opportunity |
|---|---|---|
| Master Grower needs long-view visibility | Existing dashboards only show static data | Timeline-based visual forecast, per crop & location |
| Sales Lead needs clarity on what’s ready, not just estimated | No readiness cues → risk of overpromising | Harvest-readiness indicators, confidence scores |
| Logistics Lead needs alerts early | Email updates come too late | Forecast-change alerts & offline export |
| All roles need cross-team sync | Siloed planning tools | Shared planning calendars + API integrations |
Design Strategy Aligned to JTBD
Anticipatory UI: Forecast trendlines, readiness timelines, and yield deltas
Role-based dashboards: Tailored views per persona: grower, sales, logistics
Modular alerts: Configurable push/SMS/email alerts tied to yield shifts
Cross-system integrations: CRM + ERP integrations through API tokens
Offline usability: Tablet-ready yield plans for in-field use
Positioning vs Competitors
| Tool | Strengths | Weaknesses | JTBD Gaps |
|---|---|---|---|
| LetsGrow | Sensor-driven control systems | Data-heavy, UI rigid | No clear role-specific job framing |
| iUNU | Strong on imaging and AI | Poor on UX, generic dashboards | No planning/scheduling support |
| Koidra Inc. | AI-driven decision tools | Hard to configure, limited visual UX | Misses the emotional layer of JTBD (trust, control) |
| HarvestAI | Role-specific design + predictive UX | Early-stage but flexible | Designed from JTBD up—focused on outcomes, not features |
Outcome
Reduced mismatch between projected vs. actual yield by 21% (pilot phase)
Improved planning lead time by +3 days across logistics operations
Sales team reported fewer client “pullbacks” during promotional campaigns
How Design Decisions Supported Product Goals
Aligned UX with Core Business Objectives: Every design choice from information hierarchy to interaction flows, was made to directly support measurable product goals such as yield accuracy, workflow efficiency, and stakeholder coordination.
Data-Driven Prioritization: Focused design effort on areas with the highest user pain points (e.g., forecast clarity, scheduling misalignment), identified through user research and stakeholder interviews.
Simplified Complex Workflows: Translated technical agronomic processes into intuitive UI components. This helped reduce the cognitive load for users like growers and logistics leads, directly improving task completion rates.
System Thinking Across Roles: Ensured cross-role coherence (Sales, Logistics, Master Grower) by designing shared visual patterns and feedback loops, improving coordination between departments.
Visual Language Mapped to Mental Models: Used role-specific color schemes and layout logic that matched each persona’s mental model, boosting usability and decision-making speed.
Iterative Prototyping for Faster Validation: Delivered interactive prototypes early to align product direction with user expectations. This minimized rework and kept the roadmap lean and focused.
Accessibility and Scalability Considerations: Created layouts and components that supported expansion (e.g., more crop types, more users) without needing redesign, ensuring the product could scale with business growth.
Design Process
Wireframes
Mapped workflows across planning, tracking, and adjusting harvests. Created low-fi wireframes with Balsamiq to iterate fast on layout and logic.
Key features introduced early:
- CV image gallery with overlays for ripeness level
- Forecast curve with confidence intervals
- Harvest adjustment sliders
- Offline mode sync status bar
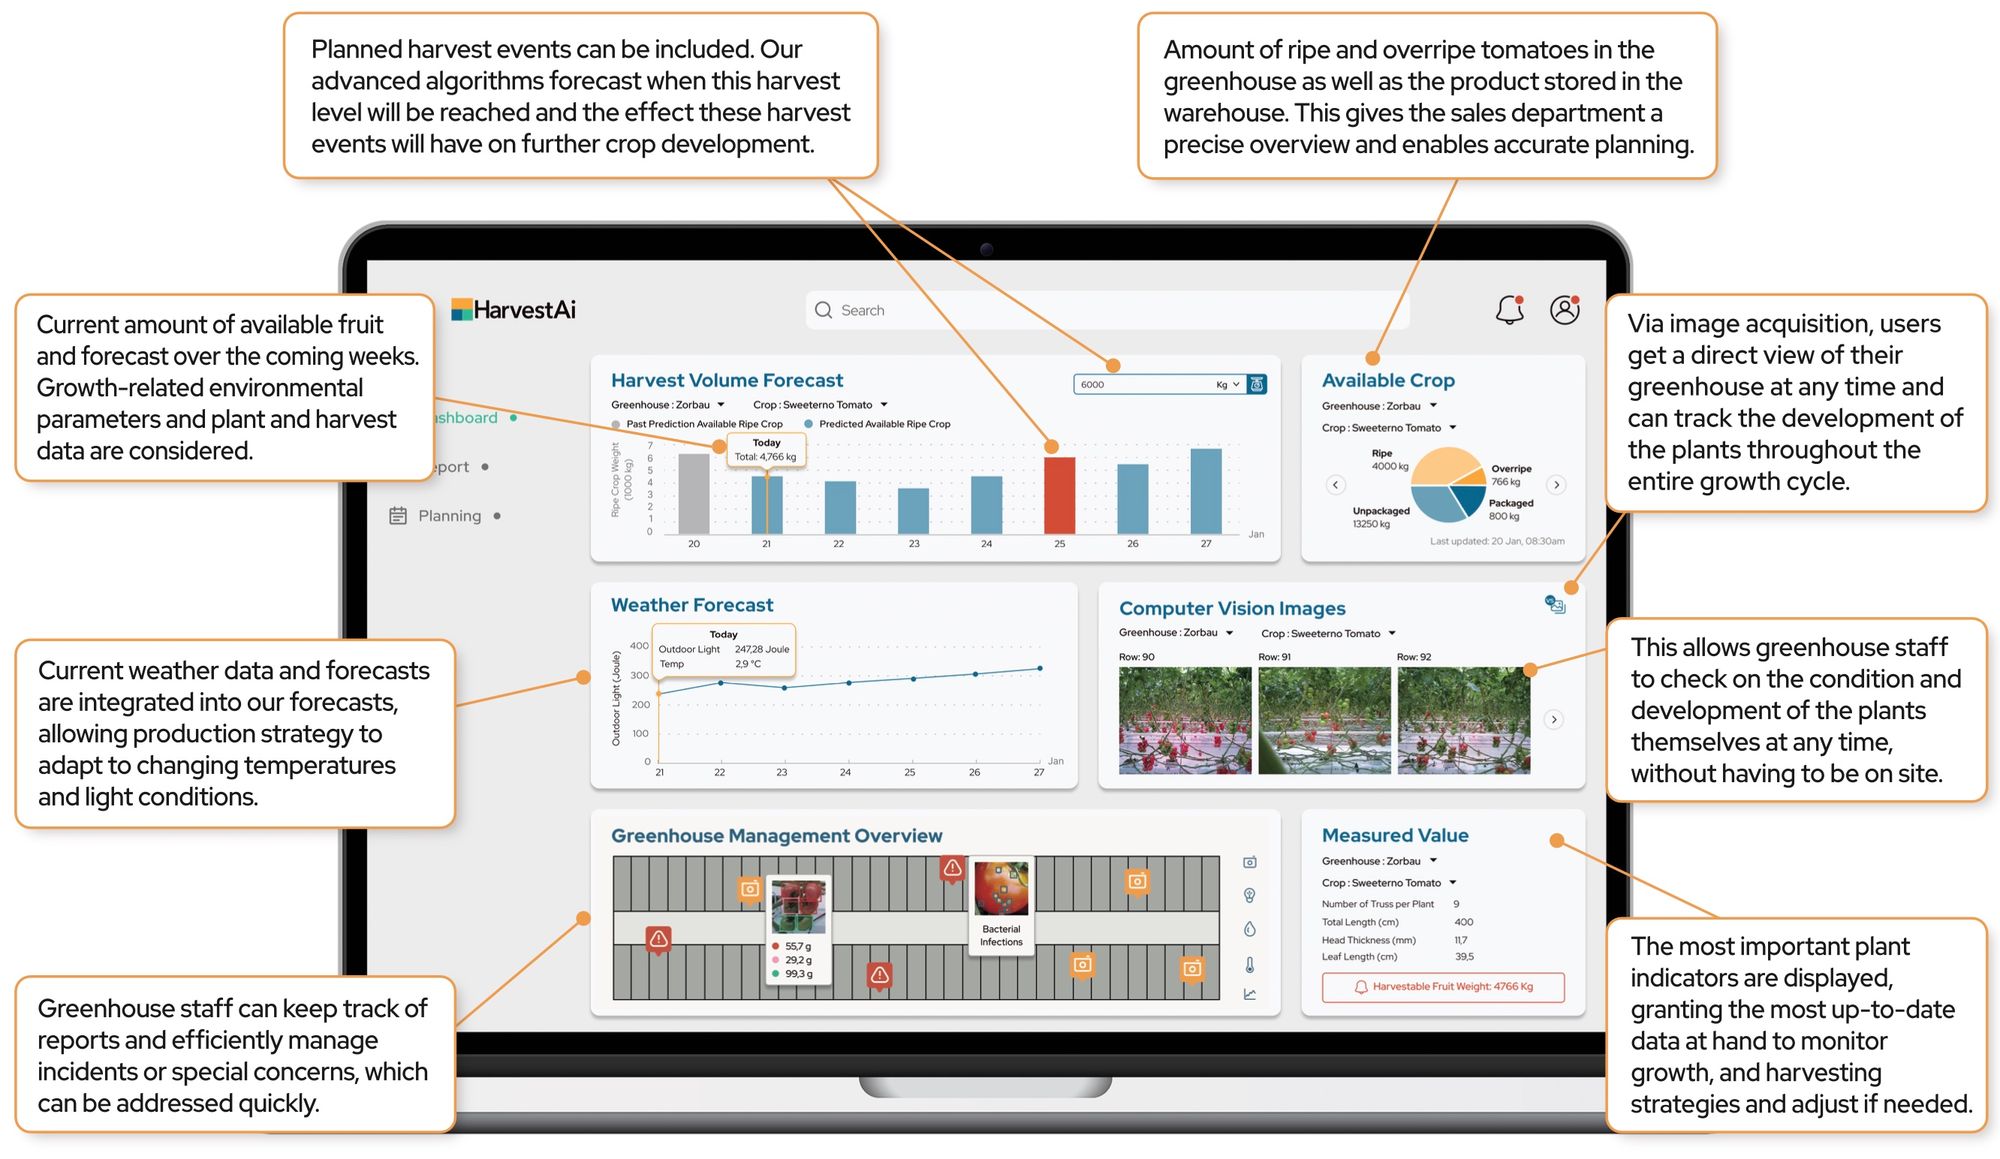
UI Design (Figma)
Designed a high-contrast, minimal UI to stay legible in sunlight-heavy greenhouses. Built a component system with:
- Modular dashboard cards
- Toggleable detail views
- Predictive tooltips & help guides
- Compact, real-time calendar view
Usability Testing
- Reduced feature overload by grouping actions into progressive disclosure
- Added onboarding walkthrough with embedded help cues
- Improved crop image gallery interaction with pinch-to-zoom and filter by maturity
- Usability Testing (n=10): Tasked growers with scenarios like “Adjust a harvest plan for next week.” Initial success rate: 70%.
- A/B Testing: Compared two CV visualization styles—one with heatmaps, another with icons. Icons improved comprehension by 45%.
- Stakeholder Reviews: Data scientists identified latency issues in CV; I adjusted the UI to cache data offline, ensuring reliability.
Feedback & Iterations:
- “Too many steps to adjust forecasts.” Reduced clicks from 5 to 2 by adding a quick-edit sidebar.
- “CV visuals need context.” Added tooltips (e.g., “Yellow = 2 days to ripe”) and a legend, boosting understanding by 50%.
- “Offline mode is a must.” Implemented a sync feature, allowing 24-hour offline access with automatic updates upon reconnection.
Results:
- Task success rate: 96%
- Time-on-task reduction: 42%
- System Usability Score: 89
Final Features
|
Feature |
Impact |
|
AI
Yield Forecasts (14-day) |
12–15%
improvement in accuracy over manual methods |
|
Image Tracker |
Enhanced
trust in data; 90% of users used it daily |
|
Harvest
Planning Tool |
Reduced
weekly planning time from 3h → 45 min |
|
Offline
Sync Mode |
Enabled
24-hour offline usage with auto re-sync |
|
Exportable
Reports |
Replaced
Excel tracking; compatible with logistics systems |
Final Outcomes
- Accuracy Improvement: AI and CV integration increased yield prediction precision by 12-15%.
- Efficiency Gains: Reduced harvest planning time by 75%, from 3 hours to 45 minutes weekly.
- User Adoption: 90% of test users rated the platform as "essential" to their workflow.
- Economic Impact: In a 10-acre greenhouse, the software reduced overproduction by 8%, saving $12,000 in a single season.
Cross-Functional Benefits Built-In:
|
Feature |
Benefit |
|
Shared
“Final Forecast Board” |
Reduces
silos across grower → sales → delivery |
|
AI
Confidence + Human Override |
Balances
prediction power with ground truth |
|
Export
Formats (CSV, Email, Slack) |
Saves
time across all departments |
|
Timeline
Logging |
Accountability
without micromanagement |
|
Alert
Logic (Push only on confirm) |
Avoids
noise; focuses attention |
Business Impact
- €12,000 saved in first season from reduced overproduction
- 8% reduction in spoilage due to more accurate harvests
- 90% adoption in pilot program within 3 weeks
- Platform rolled out to 5 additional greenhouses after pilot
Key Takeaways
- Design for trust: In data-heavy environments, users need visual proof to believe the numbers.
- Deep user understanding is crucial: Spending time in greenhouses to observe workflows and identify pain points firsthand.
- Offline is not a nice-to-have: For rural or industrial users, offline capability is a core feature.
- Design systems scale decisions: With a strong component library, I was able to ship new features faster and ensure consistency across modules.
- Being solo doesn’t mean working alone. I collaborated closely with data science, engineering, and end users to validate every step.
Reflections
This project reinforced the importance of:
- User-Centered Design: Deep engagement with end-users leads to solutions that truly address their needs.
- Iterative Development: Continuous testing and refinement are key to creating intuitive interfaces.
- Contextual Awareness: Understanding the operational environment ensures the platform's features are practical and reliable


